

Returns shown in USD.
Which is a better investment: TCS or INFY?
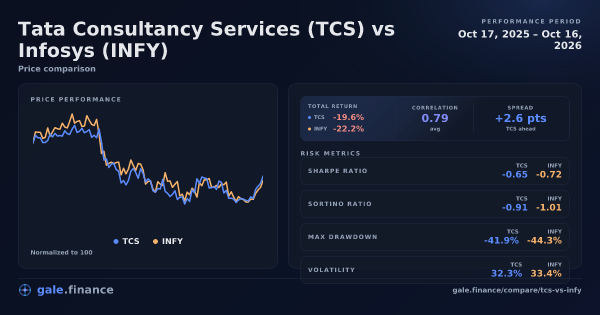
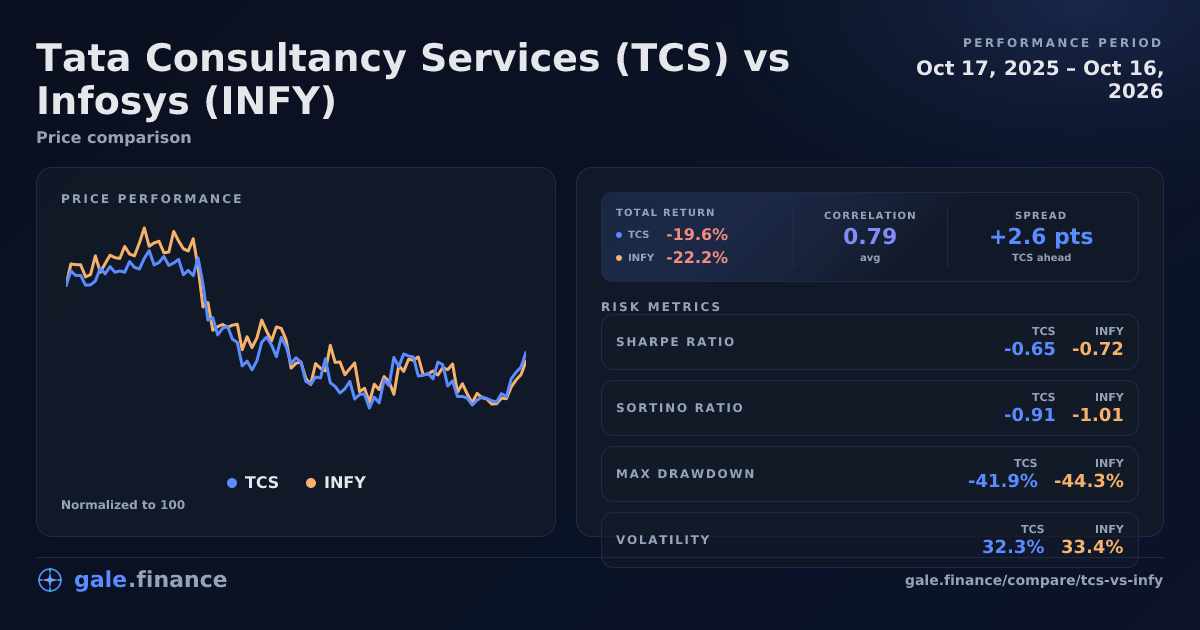
From October 17, 2025 to October 16, 2026: TCS led on total return (-19.6% vs INFY -22.2%). TCS had the higher Sharpe ratio (-0.65 vs INFY -0.72). Both Sharpe ratios were negative; a higher value was less negative. On observed risk, TCS had lower annualized volatility (32.3% vs INFY 33.4%); TCS had a smaller maximum drawdown (-41.9% vs INFY -44.3%).
Metric winners: Total Return: TCS; Sharpe Ratio: TCS; Annualized Volatility: TCS (less volatile); Max Drawdown: TCS (smaller drawdown).
Cite This Comparison
"Tata Consultancy Services vs Infosys (TCS vs INFY): Returns, Risk & Volatility (2026)." Gale Finance, October 20, 2026. https://www.gale.finance/compare/tcs-vs-infy/ Free to use with attribution. Please link back to this page or gale.finance.
Relative Performance of TCS vs INFY (Normalized to 100)
Normalized to 100 at start date for comparison
Trade TCS or INFY
Access these assets on trusted platforms.
Key Takeaways
- Total Return: TCS delivered a -19.6% total return, while INFY returned -22.2% over the same period. TCS outperformed on total returns.
- Risk-Adjusted Return (Sharpe Ratio): Both Sharpe ratios were negative (TCS -0.65 vs INFY -0.72), meaning both underperformed the risk-free rate; TCS was less negative.
- Volatility (Annualized): INFY was more volatile, with 33.4% annualized volatility, versus 32.3% for TCS.
- Maximum Drawdown: TCS's maximum drawdown was -41.9%, while INFY experienced a deeper drawdown of -44.3%.
- Tail Risk (VaR & Expected Shortfall): At the 5% level (daily log returns), TCS's VaR was -3.33% and its Expected Shortfall (CVaR) was -4.87%; INFY's were -3.56% and -5.00%. VaR is the cutoff; Expected Shortfall is the average move on the worst days.
- Skew & Kurtosis: Skew: TCS -0.10 vs INFY -0.11. Excess kurtosis: TCS 2.58 vs INFY 1.49. Negative skew leans downside; higher excess kurtosis means fatter tails.
- Tail Days & Extremes: 2σ tail days (down/up): TCS 8/8, INFY 7/10. Worst day: TCS -8.11% (2026-06-03) vs INFY -7.44% (2026-02-04). Best day: TCS +7.90% (2026-10-13) vs INFY +5.52% (2026-01-16).
- Risk ratios: Sortino - TCS: -0.91 vs. INFY: -1.01 , Calmar - TCS: -0.47 vs. INFY: -0.50 , Sterling - TCS: -0.56 vs. INFY: -0.59 , Treynor - TCS: -1.14 vs. INFY: -6.04 , Ulcer Index - TCS: 26.73% vs. INFY: 28.68%
Investment Comparison
If you invested $10,000 in each asset on October 17, 2025:
Difference: $257.52 (TCS ahead)
Tata Consultancy Services vs Infosys Performance Over Time
| Metric | TCS | INFY |
|---|---|---|
| 30 Days | 15% | 11.2% |
| 90 Days | 11.1% | 8.3% |
| 180 Days | -4.2% | -11.4% |
| 1 Year | -19.6% | -22.2% |
Shorter time frames can show different leaders as market conditions change. Consider your investment horizon when comparing performance.
Tata Consultancy Services vs Infosys Correlation

Tata Consultancy Services and Infosys were strongly correlated from October 17, 2025 to October 16, 2026. The reported average correlation of 0.79 showed strong positive linear co-movement in the observed sample.
Correlation alone does not establish portfolio risk reduction or predict selloff behavior. This comparison does not model a combined portfolio.
| Metric | Value |
|---|---|
| Current (30-day) | 0.76 |
| Average (full period) | 0.79 |
| Minimum (30-day rolling) | 0.51 |
| Maximum (30-day rolling) | 0.94 |
Correlation measures linear co-movement of returns: near +1 indicates strong positive co-movement, near 0 indicates weak linear co-movement, and negative values indicate inverse co-movement. Near-zero correlation does not establish independence. Current, minimum, and maximum figures are 30-day rolling correlations on shared daily returns.
Drawdown
Tata Consultancy Services experienced its maximum drawdown of -41.9% from 2025-12-22 to 2026-07-01. It has not yet recovered to its previous peak.
Infosys experienced its maximum drawdown of -44.3% from 2025-12-22 to 2026-10-07. It has not yet recovered to its previous peak.
Smaller drawdowns and faster recoveries indicate lower downside risk and greater resilience during market stress.
Tata Consultancy Services vs Infosys Volatility (TCS vs INFY)
Tata Consultancy Services's 32.3% annualized volatility translates to about ±2.03% one-standard-deviation daily volatility.
Infosys's 33.4% annualized volatility translates to about ±2.1% one-standard-deviation daily volatility.
INFY had the wider volatility profile over this window. That means its day-to-day return distribution was broader; TCS was calmer, but lower volatility does not by itself mean better returns.
Treat the ± daily figure as a one-standard-deviation estimate from historical returns, not a forecast or expected absolute daily move. For context, 15-18% annualized volatility is roughly ±1% one-standard-deviation daily volatility.
Risk-adjusted ratios
Sharpe Ratio of TCS and INFY
Sharpe Ratio: TCS vs. INFY
Return per total volatilitySharpe gives us excess return per unit of risk. Upside and downside volatility both count as risk.
Sharpe ratio measures return per unit of risk (volatility). A higher Sharpe indicates better risk-adjusted performance. Both Sharpe ratios were negative (TCS -0.65 vs INFY -0.72), meaning both underperformed the risk-free rate; TCS was less negative.
A Sharpe above 1.0 is generally considered good, above 2.0 is excellent. Negative Sharpe means the asset underperformed the risk-free rate. Calculated on each asset's full 365-day lookback of available prices and annualized using the asset calendar (365 for crypto, 252 trading days for equities/ETFs/metals).
Sortino Ratio of TCS and INFY
Sortino Ratio: TCS vs. INFY
Return per downside volatilitySortino keeps the return-over-risk idea, but only returns below the target rate count as volatility.
Sortino ratio measures return per unit of downside risk. Unlike Sharpe, it only counts downside deviation (returns below the target return). TCS had better downside-adjusted returns.
A higher Sortino is better. It's useful when upside volatility is common (crypto is the obvious example). Downside deviation: TCS 23.2% vs INFY 23.8%. Calculated on each asset's full 365-day lookback of available prices, using the daily risk-free rate as the target return, and annualized using the asset calendar (365 for crypto, 252 trading days for equities/ETFs/metals).
Calmar Ratio of TCS and INFY
Calmar Ratio: TCS vs. INFY
CAGR per worst drawdownCalmar compares CAGR against the single deepest peak-to-trough loss over the period.
Calmar ratio compares CAGR to maximum drawdown. Higher Calmar means more return per unit of worst drawdown. TCS posted the higher Calmar ratio.
Calmar is computed on each asset's full 365-day lookback and uses the max drawdown over that same window.
Sterling Ratio of TCS and INFY
Sterling Ratio: TCS vs. INFY
Return per average drawdownSterling smooths the drawdown penalty by using average drawdown events instead of only the worst one.
Sterling ratio measures excess return per unit of average drawdown (typically drawdowns worse than 10%). TCS posted the higher Sterling ratio.
Sterling uses average drawdown events deeper than 10% and subtracts the risk-free rate to report excess return.
Treynor Ratio of TCS and INFY
Treynor Ratio: TCS vs. INFY
Excess return per market betaTreynor divides excess annualized return by beta — the sensitivity of the asset to broad-market moves. The slope shown is each asset’s beta vs SPY.
Treynor ratio measures excess return per unit of market risk (beta) instead of total volatility. TCS posted the higher Treynor ratio.
Treynor uses beta vs the S&P 500 (SPY) on shared dates and the average 3-month Treasury rate as the risk-free rate.
Ulcer Index of TCS and INFY
Ulcer Index: TCS vs. INFY
Drawdown painUlcer Index is a risk index, not a return-over-risk ratio. Lower means smaller and shorter drawdowns.
Ulcer Index captures drawdown depth and duration. Lower Ulcer Index means less drawdown pain. TCS had the lower Ulcer Index (less drawdown pain).
Ulcer Index is computed from each asset's drawdown series over the full lookback window.
Tail Risk & Distribution Shape (1-Year): Tata Consultancy Services vs. Infosys
This section looks at the shape of daily returns, not just the average. Tail stats are computed per asset on its own daily series (crypto includes weekends). We use daily log returns so multi-day moves add cleanly.
Definitions: Value at Risk (VaR), Expected Shortfall, skew, kurtosis, and fat tails.
Tail Risk & Distribution Shape: TCS vs. INFY (1-Year)
Actual daily return tailsThe bars are real daily log-return observations from the article window. Darker bars are observations at or beyond each asset’s 5% VaR cutoff.
| Metric (1-Year) | TCS | INFY |
|---|---|---|
| 5% VaR (daily log return) | -3.33% | -3.56% |
| 5% Expected Shortfall (CVaR) | -4.87% (worst 13 days) | -5.00% (worst 13 days) |
| Skew | -0.10 | -0.11 |
| Excess kurtosis | 2.58 | 1.49 |
| 2σ tail days (down / up) | 8 / 8 | 7 / 10 |
| Worst day | -8.11% (2026-06-03) | -7.44% (2026-02-04) |
| Best day | +7.90% (2026-10-13) | +5.52% (2026-01-16) |
Downside co-moves (2σ) — 1-Year
Computed on shared dates only (n=245). A “2σ downside move” means a shared-close log return more than 2 standard deviations below that asset’s own mean on this shared-date series. Dates below show simple returns (%) for readability.
Downside co-move map: TCS vs. INFY (2σ)
Shared-close daily returnsDots mark actual downside days: asset-colored dots are one-sided downside moves, and red dots are joint downside days. Grey dots add sampled shared-return context when available. The shaded lower-left zone shows where both TCS and INFY crossed their own 2σ downside threshold.
Show downside tail dates
Dates below are shared-date observations. The “Date” is the period end (close). Tail thresholds are computed on log returns, but the table shows simple returns (%) for readability. Returns are computed from the previous shared close to this one (for example, Friday → Monday includes weekend moves).
Days when both TCS and INFY had a big down day (2σ)
| Date (interval) | TCS | INFY |
|---|---|---|
| 2026-02-04 | -7.20% | -7.44% |
| 2026-02-12 | -5.64% | -5.99% |
| 2026-02-24 | -4.14% | -4.23% |
| 2026-03-19 | -4.36% | -4.54% |
| 2026-04-24 | -5.27% | -7.24% |
Days when TCS had a big down day
| Date (interval) | TCS | INFY |
|---|---|---|
| 2026-02-04 | -7.20% | -7.44% |
| 2026-02-12 | -5.64% | -5.99% |
| 2026-02-24 | -4.14% | -4.23% |
| 2026-03-19 | -4.36% | -4.54% |
| 2026-04-10 → 2026-04-13 | -4.16% | -3.35% |
| 2026-04-24 | -5.27% | -7.24% |
| 2026-05-12 | -4.84% | -4.10% |
| 2026-06-03 | -8.11% | -3.50% |
Days when INFY had a big down day
| Date (interval) | TCS | INFY |
|---|---|---|
| 2026-02-04 | -7.20% | -7.44% |
| 2026-02-12 | -5.64% | -5.99% |
| 2026-02-24 | -4.14% | -4.23% |
| 2026-03-19 | -4.36% | -4.54% |
| 2026-04-24 | -5.27% | -7.24% |
| 2026-06-19 | -3.02% | -6.24% |
| 2026-09-09 | -2.96% | -4.68% |
Read this as “how ugly the ugly days get”, not as a precise forecast. One-year samples are small, so tail estimates are inherently noisy.
Full Comparison of Tata Consultancy Services vs. Infosys (1-Year)
| Metric | TCS | INFY |
|---|---|---|
| Total Return | -19.6% | -22.2% |
| Annualized Volatility | 32.3% | 33.4% |
| Sharpe Ratio | -0.65 | -0.72 |
| Sortino Ratio | -0.91 | -1.01 |
| Calmar Ratio | -0.47 | -0.50 |
| Sterling Ratio | -0.56 | -0.59 |
| Treynor Ratio | -1.14 | -6.04 |
| Ulcer Index | 26.73% | 28.68% |
| Max Drawdown | -41.9% | -44.3% |
| Avg Correlation to S&P 500 | 0.10 | 0.03 |
| 5% VaR (daily log return) | -3.33% | -3.56% |
| 5% Expected Shortfall (CVaR) | -4.87% | -5.00% |
| Skew | -0.10 | -0.11 |
| Excess kurtosis | 2.58 | 1.49 |
| 2σ tail days (down / up) | 8 / 8 | 7 / 10 |
Audit this calculation
Formulas, inputs, and conventions used to compute the metrics on this page.
Inputs & conventions
- Shared window for pair metrics
- 2025-10-17 → 2026-10-16 (last shared close).
- Rolling correlation sample (shared closes)
- 216 rolling 30-day values (from 245 shared daily returns).
- Annualization (days/year)
- TCS: 252 days/year; INFY: 252 days/year.
- Risk-free rate
- Uses the 3-month U.S. Treasury yield (FRED: DGS3MO), averaged over each asset’s window:
- TCS: 3.82% over 2025-10-17 → 2026-10-16.
- INFY: 3.82% over 2025-10-17 → 2026-10-16.
- Volatility drag (rule of thumb)
- Estimated from annualized volatility (simple returns). For the log-return framing, see Log returns.
- TCS: ≈ -5.2%/yr
- INFY: ≈ -5.6%/yr
- Data alignment
- No forward fill. Correlation and tail co-moves are computed on shared closes only. For cross-calendar pairs (e.g., crypto vs stocks), weekend/holiday moves roll into the next shared close.
- Return conventions
- Volatility/Sharpe/Sortino use simple daily returns. Tail-risk uses daily log returns for distribution stats (but tables show simple returns). Log returns.
Formulas
- Price on day t.
- Simple daily return.
- Log daily return.
- Average daily return.
- Standard deviation of daily returns.
- Annualization factor (days/year).
- Annual risk-free rate.
Tata Consultancy Services vs Infosys: Frequently Asked Questions
Which has higher volatility: TCS or INFY?
INFY showed higher volatility at 33.4% annualized, compared to 32.3% for TCS Over the past year. Higher volatility means larger price swings in both directions.
Does TCS provide diversification when held with INFY?
TCS and INFY were strongly correlated from October 17, 2025 to October 16, 2026, with an average correlation of 0.79. Correlation alone does not establish portfolio risk reduction or predict selloff behavior. This comparison does not model a combined portfolio.
How bad are the worst 5% days for TCS vs INFY?
Over the past year, TCS's 5% VaR was -3.33% and its 5% Expected Shortfall was -4.87% (worst 13 days). INFY's were -3.56% and -5.00% (worst 13 days).
Do TCS and INFY crash together on bad days?
On shared dates (n=245), when INFY has a 2σ down day, TCS also does 71.4% (5/7 days). In the other direction, when TCS has one, INFY also does 62.5% (5/8 days).
Which has better risk-adjusted returns: TCS or INFY?
Both assets posted negative Sharpe ratios Over the past year (TCS -0.65 vs INFY -0.72), meaning both underperformed the risk-free rate; TCS was less negative.
Can TCS and INFY be combined in a portfolio?
This comparison measures the assets individually, not a combined portfolio. Portfolio risk depends on allocation weights and the joint return path; no portfolio result is calculated here. INFY had higher annualized volatility (33.4%) in this sample; the effect of an allocation is not measured here.